California-Xgb
Fri 14 November 2025
!python --version
Python 3.10.5
!pip show xgboost | grep "Version"
Version: 2.1.2
import xgboost as xgb
import pandas as pd
import numpy as np
from sklearn.datasets import fetch_california_housing
from sklearn.model_selection import train_test_split
from sklearn.metrics import mean_squared_error
# Load the California housing dataset
data = fetch_california_housing()
X = pd.DataFrame(data.data, columns=data.feature_names)
y = pd.Series(data.target)
# Split the data into training and testing sets
X_train, X_test, y_train, y_test = train_test_split(X, y, test_size=0.2, random_state=42)
# Initialize the XGBoost Regressor
xg_reg = xgb.XGBRegressor(
    objective="reg:squarederror",
    colsample_bytree=0.3,
    learning_rate=0.1,
    max_depth=5,
    alpha=10,
    n_estimators=100
)
# Train the model
xg_reg.fit(X_train, y_train)
XGBRegressor(alpha=10, base_score=None, booster=None, callbacks=None,
             colsample_bylevel=None, colsample_bynode=None,
             colsample_bytree=0.3, device=None, early_stopping_rounds=None,
             enable_categorical=False, eval_metric=None, feature_types=None,
             gamma=None, grow_policy=None, importance_type=None,
             interaction_constraints=None, learning_rate=0.1, max_bin=None,
             max_cat_threshold=None, max_cat_to_onehot=None,
             max_delta_step=None, max_depth=5, max_leaves=None,
             min_child_weight=None, missing=nan, monotone_constraints=None,
             multi_strategy=None, n_estimators=100, n_jobs=None,
             num_parallel_tree=None, ...)
In a Jupyter environment, please rerun this cell to show the HTML representation or trust the notebook. On GitHub, the HTML representation is unable to render, please try loading this page with nbviewer.org.
XGBRegressor(alpha=10, base_score=None, booster=None, callbacks=None,
             colsample_bylevel=None, colsample_bynode=None,
             colsample_bytree=0.3, device=None, early_stopping_rounds=None,
             enable_categorical=False, eval_metric=None, feature_types=None,
             gamma=None, grow_policy=None, importance_type=None,
             interaction_constraints=None, learning_rate=0.1, max_bin=None,
             max_cat_threshold=None, max_cat_to_onehot=None,
             max_delta_step=None, max_depth=5, max_leaves=None,
             min_child_weight=None, missing=nan, monotone_constraints=None,
             multi_strategy=None, n_estimators=100, n_jobs=None,
             num_parallel_tree=None, ...)
# Make predictions
y_pred = xg_reg.predict(X_test)
# Evaluate the model
rmse = np.sqrt(mean_squared_error(y_test, y_pred))
print(f"Root Mean Squared Error: {rmse}")
Root Mean Squared Error: 0.5444943782523535
# Plot feature importance (optional)
import matplotlib.pyplot as plt
xgb.plot_importance(xg_reg)
plt.show()

#!pip install graphviz
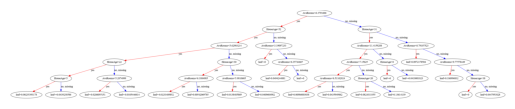
# Visualize the first tree in the model (optional)
xgb.plot_tree(xg_reg, num_trees=0)
plt.show()
Score: 10
Category: xgboost