Iris-Analysis
Fri 14 November 2025
import numpy as np
from sklearn.datasets import load_iris
from sklearn.tree import DecisionTreeClassifier, export_graphviz
from sklearn.model_selection import train_test_split
import pydotplus
from IPython.display import Image
# Load the dataset
iris = load_iris()
X = iris.data
y = iris.target
# Split the dataset
X_train, X_test, y_train, y_test = train_test_split(X, y, test_size=0.3, random_state=42)
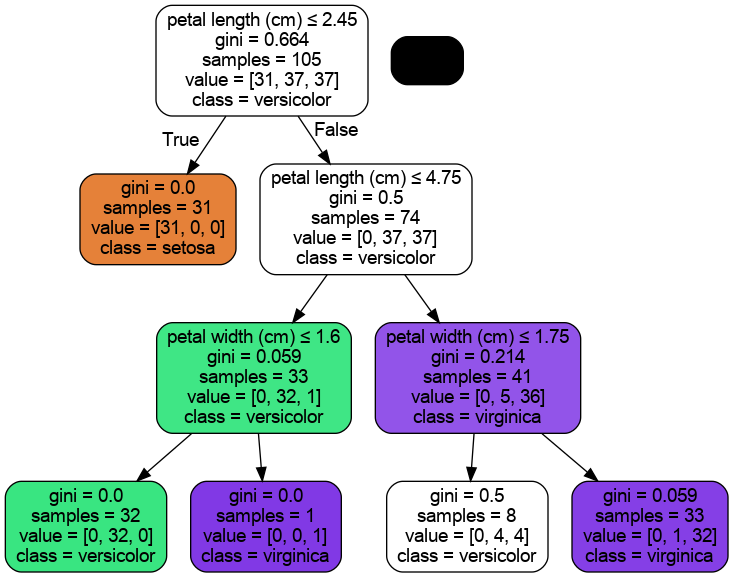
# Train the decision tree classifier
clf = DecisionTreeClassifier(max_depth=3, random_state=42)
clf.fit(X_train, y_train)
# Export the decision tree to DOT format
dot_data = export_graphviz(
clf,
out_file=None,
feature_names=iris.feature_names,
class_names=iris.target_names,
filled=True,
rounded=True,
special_characters=True
)
# Use pydotplus to create a graph from the DOT data
graph = pydotplus.graph_from_dot_data(dot_data)
# Display the graph in a Jupyter Notebook
Image(graph.create_png())
# Save the graph to a file (optional)
graph.write_png("decision_tree.png")
True
graph
<pydotplus.graphviz.Dot at 0x7fb03495bd70>
from IPython.display import Image
Image(graph.create_png())
Score: 0
Category: pydotplus