Height-Vs-Weight
Fri 14 November 2025
!python --version
Python 3.10.5
# !pip install seaborn
import seaborn as sns
import matplotlib.pyplot as plt
import pandas as pd
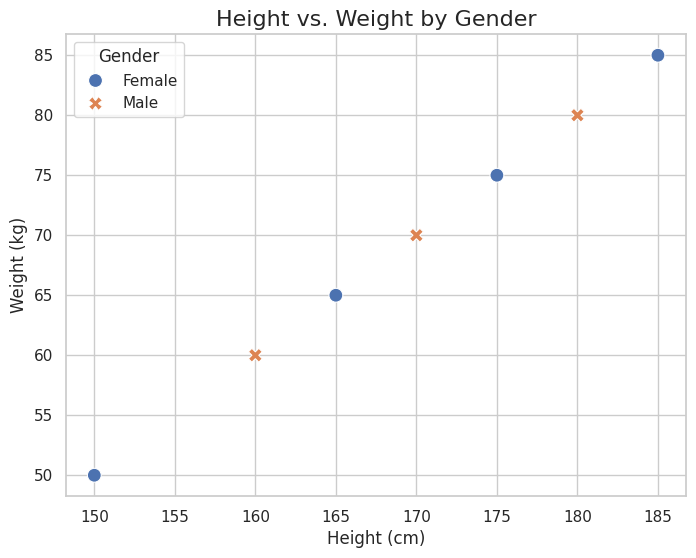
data = {
    "Height": [150, 160, 165, 170, 175, 180, 185],
    "Weight": [50, 60, 65, 70, 75, 80, 85],
    "Gender": ["Female", "Male", "Female", "Male", "Female", "Male", "Female"]
}
df = pd.DataFrame(data)
sns.set(style="whitegrid")
plt.figure(figsize=(8, 6))
scatter_plot = sns.scatterplot(data=df, x="Height", y="Weight", hue="Gender", style="Gender", s=100)

plt.title("Height vs. Weight by Gender", fontsize=16)
plt.xlabel("Height (cm)", fontsize=12)
plt.ylabel("Weight (kg)", fontsize=12)
plt.legend(title="Gender")
plt.show()
Score: 5
Category: seaborn