Auc-Curve-On-Binary-Classification
title: "AUC Curve on Binary Classification"
author: "Rj"
date: 2019-04-20
description: "List Test"
type: technical_note
draft: false
from sklearn import svm, datasets
from sklearn import metrics
from sklearn.linear_model import LogisticRegression
from sklearn.model_selection import train_test_split
from sklearn.datasets import load_breast_cancer
import matplotlib.pyplot as plt
# Load Breast Cancer Dataset
breast_cancer = load_breast_cancer()
X = breast_cancer.data
y = breast_cancer.target
# Split the Dataset
X_train, X_test, y_train, y_test = train_test_split(X, y, test_size=0.33, random_state=44)
# Model
clf = LogisticRegression(penalty='l2', C=0.1)
clf.fit(X_train, y_train)
y_pred = clf.predict(X_test)
/Users/rajacsp/anaconda3/envs/py36/lib/python3.6/site-packages/sklearn/linear_model/logistic.py:433: FutureWarning: Default solver will be changed to 'lbfgs' in 0.22. Specify a solver to silence this warning.
  FutureWarning)
# Accuracy
print("Accuracy", metrics.accuracy_score(y_test, y_pred))
Accuracy 0.9521276595744681
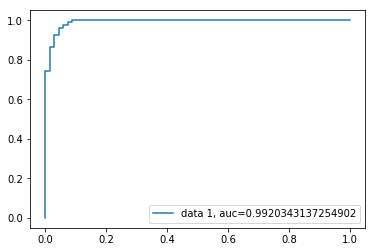
# AUC Curve
y_pred_proba = clf.predict_proba(X_test)[::,1]
fpr, tpr, _ = metrics.roc_curve(y_test,  y_pred_proba)
auc = metrics.roc_auc_score(y_test, y_pred_proba)

plt.plot(fpr,tpr,label="data 1, auc="+str(auc))
plt.legend(loc=4)
plt.show()
Score: 5
Auc-Curve-Simple
title: "AUC Curve Simple"
author: "Rj"
date: 2019-04-20
description: "List Test"
type: technical_note
draft: false
import matplotlib.pyplot as plt
import numpy as np
score = np.array([0.9, 0.8, 0.7, 0.6, 0.55, 0.54, 0.53, 0.52, 0.51, 0.505, 0.4, 0 …
Bar-Plot-With-Table
title: "Bar Plot with Table"
author: "Rj"
date: 2020-09-05
description: "List Test"
type: technical_note
draft: false
# https://matplotlib.org/3.3.1/gallery/misc/table_demo.html
import numpy as np
import matplotlib.pyplot as plt


data = [[ 66386, 174296,  75131, 577908,  32015],
        [ 58230, 381139,  78045,  99308, 160454],
        [ 89135,  80552, 152558, 497981 …
Basic-Plot
title: "Basic Plot"
author: "Rj"
date: 2019-05-06
description: "List Test"
type: technical_note
draft: false
import matplotlib.pyplot as plt
([1, 2, 3, 4], [2, 4, 9, 16])
plt.plot(x, y, 'ro')
plt.axis([0, 10, 0, 20 …
Basic-Plot-1
title: "Basic Plot With Multiple Axes"
author: "Rj"
date: 2019-05-06
description: "List Test"
type: technical_note
draft: false
import matplotlib.pyplot as plt
([1, 2, 3, 4], [1, 4, 9, 16], [1, 8 …
Bokeh-Pynotes-Growth
# https://docs.bokeh.org/en/latest/docs/first_steps/first_steps_1.html
# https://docs.bokeh.org/en/latest/_images/notebook_inline.png
# !pip install jupyter_bokeh
!pip show | grep "Version:"
�[33mWARNING: ERROR: Please provide a package name or names.�[0m�[33m
�[0m
Box-Plot
title: "Box Plot"
author: "Rj"
date: 2019-05-06
description: "List Test"
type: technical_note
draft: false
import pandas as pd
import numpy as np
abc = np.array([
    [9, 13, 10],
    [7, 12, 9],
    [19, 11, 8]
])
array([[ 9, 13, 10],
       [ 7, 12,  9],
       [19, 11,  8]])
df2 = pd.DataFrame(abc, columns …
Box-Plot-2
title: "Box Plot "
author: "Rj"
date: 2019-04-20
description: "List Test"
type: technical_note
draft: false
import matplotlib.pyplot as plt
import numpy as np
import pandas as pd
import seaborn as sns
import warnings; warnings.filterwarnings(action='once')
# Import Data
df = pd.read_csv("https://github.com/selva86/datasets/raw/master/mpg_ggplot2 …
Breakfast-Spending
title: "Breakfast Spending"
author: "Rj"
date: 2019-05-06
description: "List Test"
type: technical_note
draft: false
import matplotlib.pyplot as plt
x = [1, 2, 3, 4, 5, 6, 7, 8]
# Amount I spent on the breakfast
y = [9.12, 10.25, 11.25, 7.80, 8.90, 9.80, 10.12, 10 …
Count-Plot
title: "Count Plot (Buggy)"
author: "Rj"
date: 2020-09-05
description: "List Test"
type: technical_note
draft: false
# https://www.machinelearningplus.com/plots/top-50-matplotlib-visualizations-the-master-plots-python/
import matplotlib.pyplot as plt
import numpy as np
import pandas as pd

import seaborn as sns
import warnings; warnings.filterwarnings(action='once')

# Import Data
df = pd.read_csv("https …