09-Vwap
Fri 14 November 2025
# Created: 20250103
import pyutil as pyu
pyu.get_local_pyinfo()
'conda env: ml312-2024; pyv: 3.12.7 | packaged by Anaconda, Inc. | (main, Oct 4 2024, 13:27:36) [GCC 11.2.0]'
print(pyu.ps2("requests"))
requests==2.32.3
import yfinance as yf
import pandas as pd
import numpy as np
import matplotlib.pyplot as plt
# Step 1: Download historical data
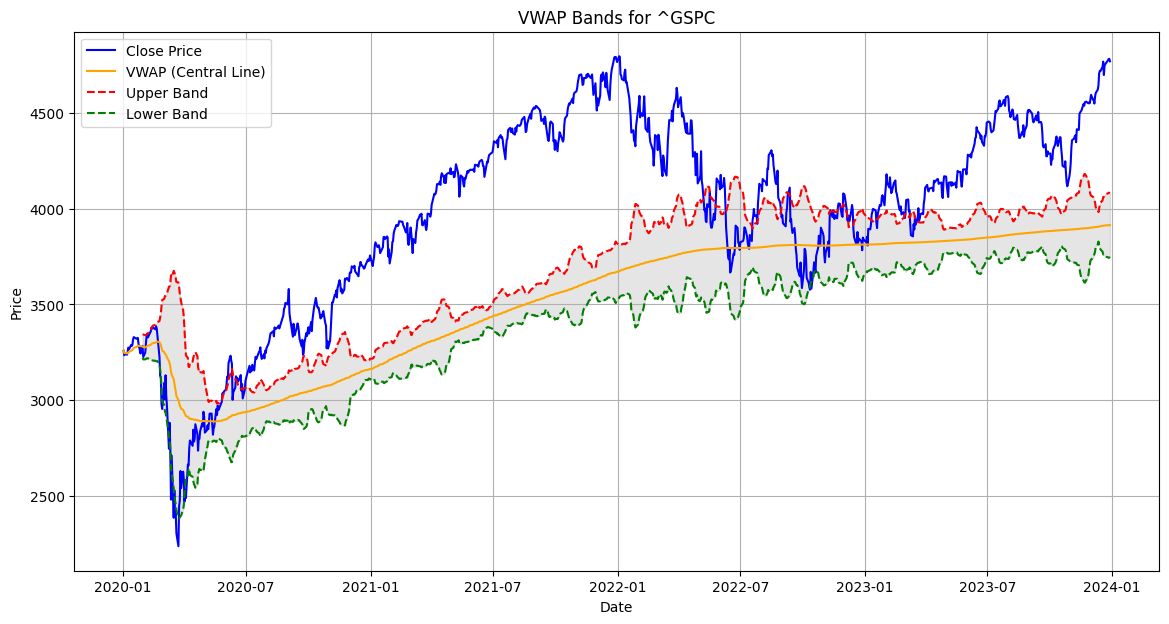
symbol = "^GSPC" # S&P 500 as an example
start = "2020-01-01"
end = "2023-12-31"
data = yf.download(symbol, start=start, end=end)
# Step 2: Calculate VWAP Bands
def vwap_bands(data, multiplier=2):
# Calculate cumulative sum of price*volume and volume
data['Cum Price*Vol'] = (data['Close'] * data['Volume']).cumsum()
data['Cum Volume'] = data['Volume'].cumsum()
# Calculate VWAP
data['VWAP'] = data['Cum Price*Vol'] / data['Cum Volume']
# Calculate rolling standard deviation of the Close price
data['Std Dev'] = data['Close'].rolling(window=20).std()
# Calculate Upper and Lower Bands
data['Upper Band'] = data['VWAP'] + (multiplier * data['Std Dev'])
data['Lower Band'] = data['VWAP'] - (multiplier * data['Std Dev'])
return data
# Apply the function
data = vwap_bands(data)
# Step 3: Plot VWAP Bands
plt.figure(figsize=(14, 7))
plt.plot(data['Close'], label='Close Price', color='blue')
plt.plot(data['VWAP'], label='VWAP (Central Line)', color='orange', linestyle='-')
plt.plot(data['Upper Band'], label='Upper Band', color='red', linestyle='--')
plt.plot(data['Lower Band'], label='Lower Band', color='green', linestyle='--')
plt.fill_between(data.index, data['Lower Band'], data['Upper Band'], color='gray', alpha=0.2)
plt.title(f'VWAP Bands for {symbol}')
plt.xlabel('Date')
plt.ylabel('Price')
plt.legend(loc='best')
plt.grid(True)
plt.show()
[*********************100%***********************] 1 of 1 completed
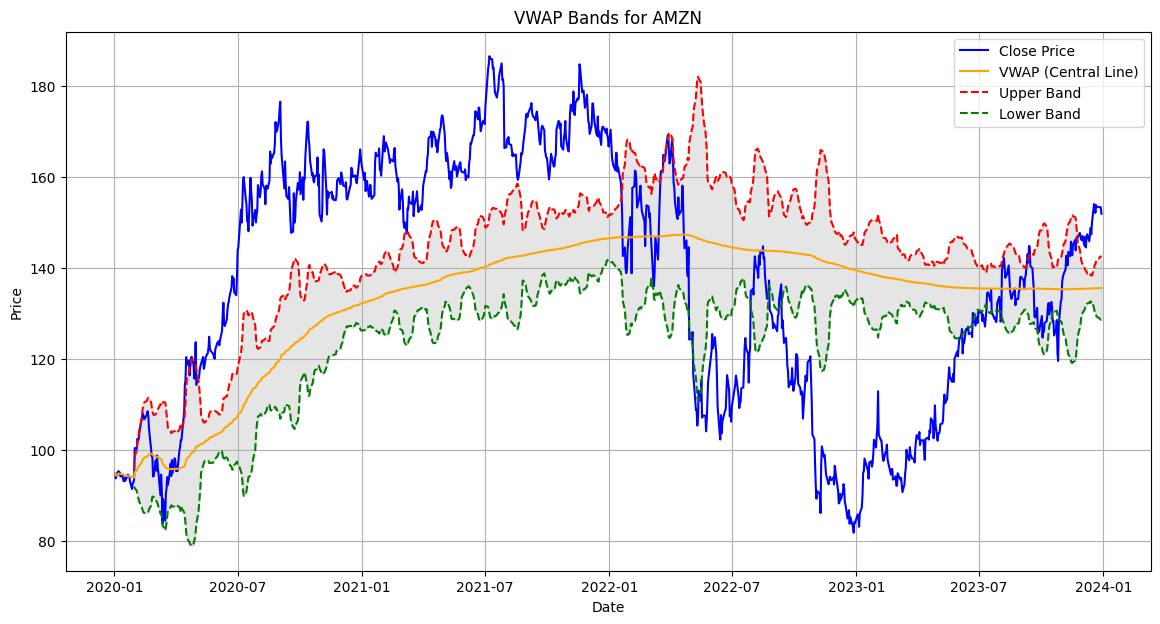
def show_vwap(symbol):

    # Step 1: Download historical data
    start = "2020-01-01"
    end = "2023-12-31"
    data = yf.download(symbol, start=start, end=end)

    # Apply the function
    data = vwap_bands(data)

    # Step 3: Plot VWAP Bands
    plt.figure(figsize=(14, 7))
    plt.plot(data['Close'], label='Close Price', color='blue')
    plt.plot(data['VWAP'], label='VWAP (Central Line)', color='orange', linestyle='-')
    plt.plot(data['Upper Band'], label='Upper Band', color='red', linestyle='--')
    plt.plot(data['Lower Band'], label='Lower Band', color='green', linestyle='--')
    plt.fill_between(data.index, data['Lower Band'], data['Upper Band'], color='gray', alpha=0.2)
    plt.title(f'VWAP Bands for {symbol}')
    plt.xlabel('Date')
    plt.ylabel('Price')
    plt.legend(loc='best')
    plt.grid(True)
    plt.show()
show_vwap("AMZN")
[*********************100%***********************] 1 of 1 completed
Score: 5
Category: stockmarket