18-Volume-Profile
Fri 14 November 2025
# Created: 20250103
import pyutil as pyu
pyu.get_local_pyinfo()
'conda env: ml312-2024; pyv: 3.12.7 | packaged by Anaconda, Inc. | (main, Oct 4 2024, 13:27:36) [GCC 11.2.0]'
print(pyu.ps2("requests"))
requests==2.32.3
import yfinance as yf
import pandas as pd
import numpy as np
import matplotlib.pyplot as plt
import yfinance as yf
import pandas as pd
import numpy as np
import matplotlib.pyplot as plt

# Step 1: Download historical data
symbol = "^GSPC"  # S&P 500 as an example
start = "2020-01-01"
end = "2023-12-31"
data = yf.download(symbol, start=start, end=end)

# Step 2: Calculate Volume Profile
def calculate_volume_profile(data, bins=50):
    # Ensure the necessary columns exist
    if 'High' not in data.columns or 'Low' not in data.columns or 'Volume' not in data.columns:
        raise KeyError("Required columns ('High', 'Low', 'Volume') are missing in the data.")

    # Calculate the midpoint price for each day
    data['Mid Price'] = (data['High'] + data['Low']) / 2

    # Drop any rows with NaN values to ensure alignment
    valid_data = data.dropna(subset=['Mid Price', 'Volume'])

    # Define the price range
    price_min = valid_data['Mid Price'].min()
    price_max = valid_data['Mid Price'].max()

    # Create price bins
    price_bins = np.linspace(price_min, price_max, bins + 1)

    # Use np.histogram to calculate volume for each bin
    volume, bin_edges = np.histogram(valid_data['Mid Price'], bins=price_bins, weights=valid_data['Volume'])

    # Create a DataFrame for the volume profile
    volume_profile = pd.DataFrame({
        'Price Bin': bin_edges[:-1],
        'Volume': volume
    })

    return volume_profile

# Apply the Volume Profile calculation
try:
    volume_profile = calculate_volume_profile(data)
    print("Volume Profile:\n", volume_profile.head())  # Debug output to ensure it's created
except KeyError as e:
    print("KeyError:", e)
except Exception as e:
    print("An error occurred:", e)

# Step 3: Plot Volume Profile
if 'volume_profile' in locals() and not volume_profile.empty:
    plt.figure(figsize=(10, 7))
    plt.barh(volume_profile['Price Bin'], volume_profile['Volume'],
             height=(volume_profile['Price Bin'].iloc[1] - volume_profile['Price Bin'].iloc[0]),
             color='blue', alpha=0.7)
    plt.title(f'Volume Profile for {symbol}')
    plt.xlabel('Volume')
    plt.ylabel('Price')
    plt.grid(True)
    plt.show()
else:
    print("Volume Profile is not defined or empty.")
[*********************100%***********************]  1 of 1 completed

KeyError: ['Mid Price', 'Volume']
Volume Profile is not defined or empty.
def show_graph(symbol):

pass
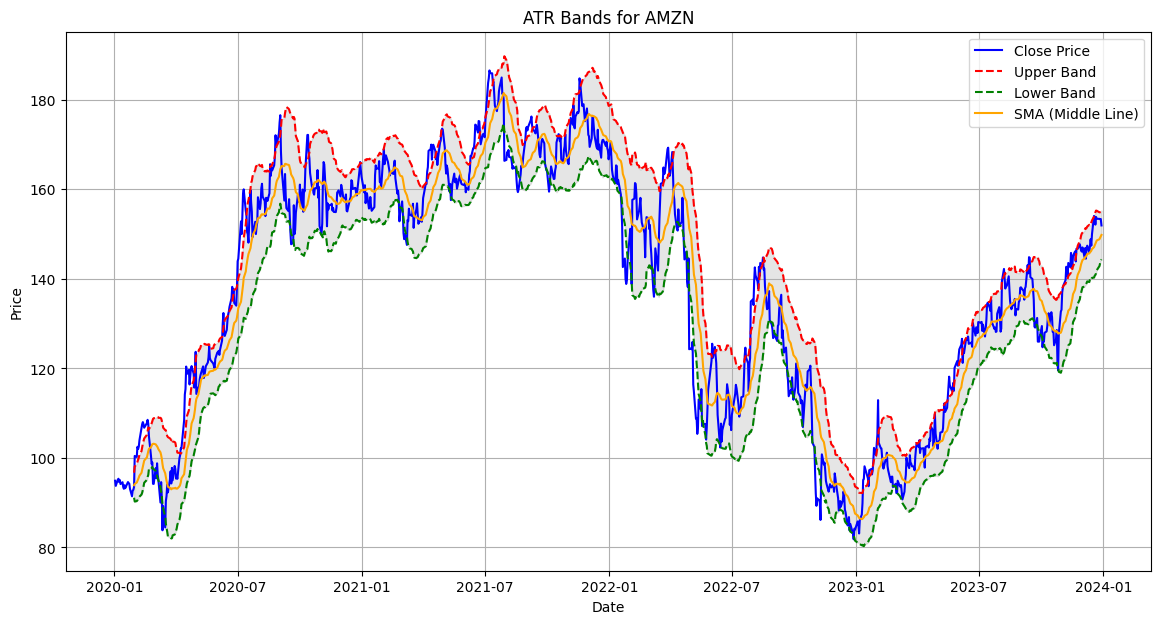
show_graph("AMZN")
[*********************100%***********************] 1 of 1 completed
Score: 5
Category: stockmarket