Box-Plot
Fri 14 November 2025
title: "Box Plot" author: "Rj" date: 2019-05-06 description: "List Test" type: technical_note draft: false
import pandas as pd
import numpy as np
abc = np.array([
    [9, 13, 10],
    [7, 12, 9],
    [19, 11, 8]
])
abc
array([[ 9, 13, 10],
       [ 7, 12,  9],
       [19, 11,  8]])
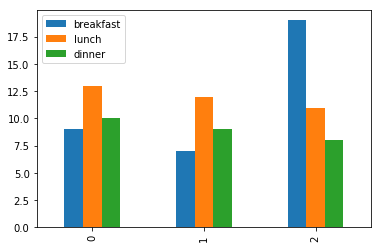
df2 = pd.DataFrame(abc, columns=['breakfast', 'lunch', 'dinner'])
df2.plot.bar()
<matplotlib.axes._subplots.AxesSubplot at 0x114cacf28>
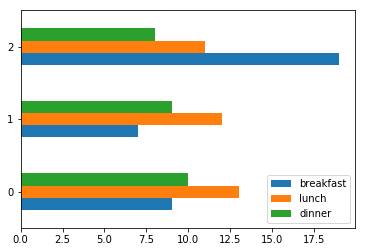
df2.plot.barh()
<matplotlib.axes._subplots.AxesSubplot at 0x114aa1278>
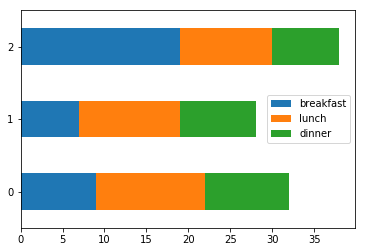
df2.plot.barh(stacked=True)
<matplotlib.axes._subplots.AxesSubplot at 0x114caccc0>
Score: 10
Category: plot