Bubble-1
Fri 14 November 2025
import matplotlib.pyplot as plt
import collections
import numpy as np
# Generate random data
data = [tuple(pair)
for pair in np.random.uniform(5, size=(20, 2))
for c in range(np.random.randint(1, 50))] # Replaced random_integers
# Count occurrences of each point
count = collections.Counter(data)
# Print the count dictionary
print(count)
# Extract points and sizes for plotting
points = count.keys()
x, y = zip(*points)
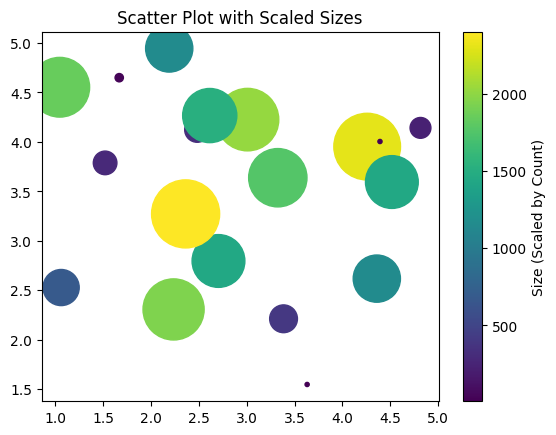
sizes = np.array(list(count.values())) ** 2 # Convert count.values() to list for NumPy array
plt.scatter(x, y, s=sizes, marker='o', c=sizes, cmap='viridis')
plt.colorbar(label='Size (Scaled by Count)')
plt.title("Scatter Plot with Scaled Sizes")
plt.show()
Counter({(2.361085781294581, 3.272152844453665): 49, (4.258723861901829, 3.9521509329872395): 48, (3.0082729062663787, 4.225021610388168): 45, (2.2353877393602515, 2.306628886515928): 44, (1.0458457356072381, 4.552167958472387): 43, (3.324743128314727, 3.6376355418596034): 42, (2.613351331510619, 4.265957830594543): 39, (4.516791048251102, 3.5941998241597917): 38, (2.7046552476383416, 2.7962772905621303): 38, (2.1898274503422144, 4.9439432998337685): 34, (4.35949284397131, 2.617970373026386): 34, (1.0603965347012152, 2.5278744728573592): 26, (3.384672954391111, 2.2120854078003718): 20, (2.4822618218836445, 4.122247188107845): 18, (1.5197810619123024, 3.7875905027650236): 17, (4.815873016026179, 4.141424733094553): 15, (4.813285541362392, 4.133336265765271): 9, (1.6673842277083653, 4.648658319608122): 6, (3.6312128931592427, 1.5481656818917884): 3, (4.39254898700022, 4.00380248427395): 3})
Score: 0
Category: barchart