Bubble-2
Fri 14 November 2025
import matplotlib.pyplot as plt
import collections
import numpy as np
# Generate random data
data = [tuple(pair)
for pair in np.random.uniform(5, size=(20, 2))
for _ in range(np.random.randint(1, 50))] # Replaced random_integers
# Count occurrences of each point
count = collections.Counter(data)
# Print the count dictionary
print(count)
# Extract points and sizes for plotting
points = list(count.keys())
x, y = zip(*points)
sizes = np.array(list(count.values())) ** 2 # Convert count.values() to a list for NumPy array
# Create scatter plot
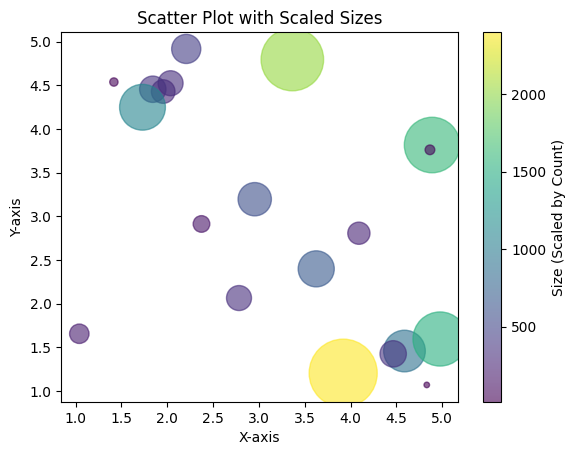
plt.scatter(x, y, s=sizes, marker='o', c=sizes, cmap='viridis', alpha=0.6)
plt.colorbar(label='Size (Scaled by Count)')
plt.title("Scatter Plot with Scaled Sizes")
plt.xlabel("X-axis")
plt.ylabel("Y-axis")
plt.show()
Counter({(3.9198872350850977, 1.2034242223014848): 49, (3.3649570394276678, 4.794393187151185): 45, (4.890288724959874, 3.81582730832123): 40, (4.976952356217479, 1.594633890153791): 39, (1.7295193354937606, 4.248344928898058): 33, (4.5889079105955775, 1.456821874574032): 30, (3.6256443417172393, 2.3979120152119413): 26, (2.954492971496893, 3.195299750634756): 24, (2.206775725648359, 4.916218352555024): 21, (4.46557113858351, 1.4245566958150362): 19, (1.8417864958348726, 4.454704826429267): 19, (2.7828426503473254, 2.063540230047747): 18, (2.0359590126479445, 4.523540298827046): 18, (1.955456447328182, 4.4281229197776355): 17, (4.091190308742341, 2.8058509871662642): 16, (1.0398978137900863, 1.6547273611729882): 14, (2.3732419333546857, 2.9118943175574383): 12, (4.866776356920866, 3.760800440300094): 7, (1.4171742520350725, 4.537152207469616): 6, (4.832128380567339, 1.0687644646656693): 4})
Score: 0
Category: barchart