Titanic
Fri 14 November 2025
import pandas as pd
from sklearn.model_selection import train_test_split
from sklearn.tree import DecisionTreeClassifier, export_graphviz
import pydotplus
from IPython.display import Image
# Load the Titanic dataset
url = "https://raw.githubusercontent.com/datasciencedojo/datasets/master/titanic.csv"
titanic = pd.read_csv(url)
# Preprocess the dataset
# Select features and target variable
features = ['Pclass', 'Sex', 'Age', 'SibSp', 'Parch', 'Fare']
titanic = titanic[features + ['Survived']]
# Encode categorical variables
titanic['Sex'] = titanic['Sex'].map({'male': 0, 'female': 1})
# Handle missing values by filling them with the median
titanic['Age'] = titanic['Age'].fillna(titanic['Age'].median())
# Split the dataset
X = titanic[features]
y = titanic['Survived']
X_train, X_test, y_train, y_test = train_test_split(X, y, test_size=0.3, random_state=42)
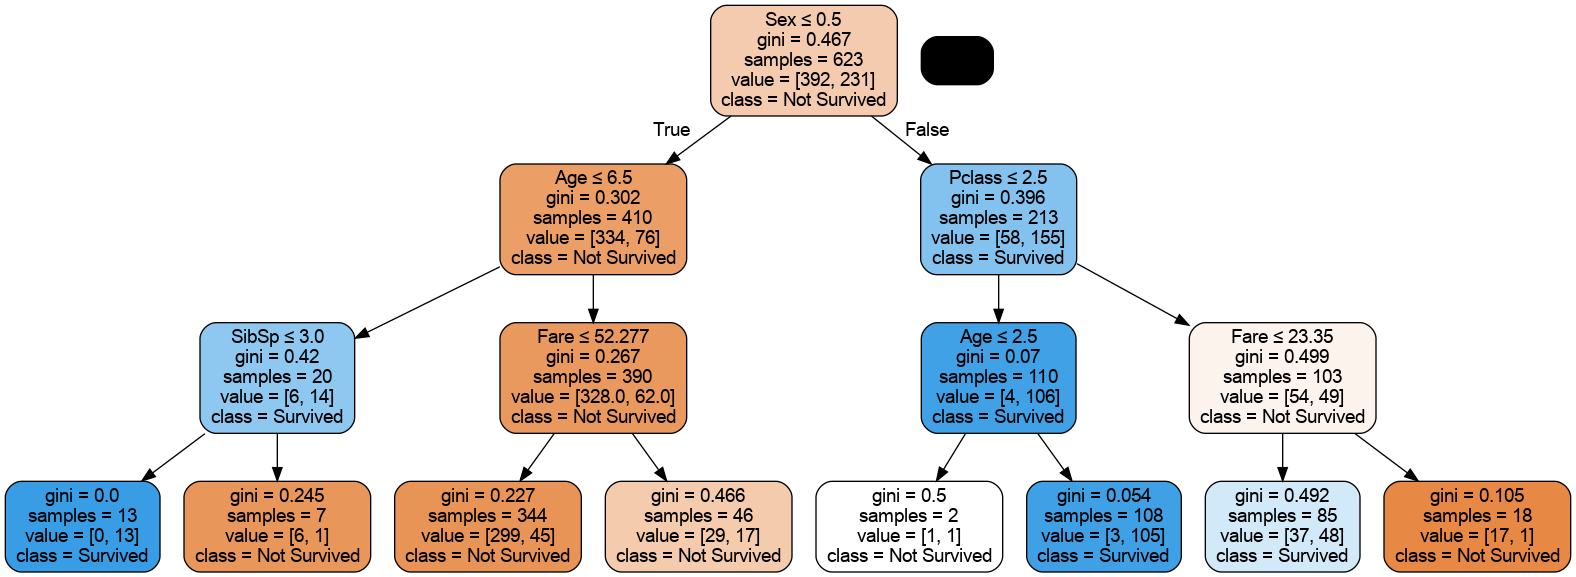
# Train a decision tree classifier
clf = DecisionTreeClassifier(max_depth=3, random_state=42)
clf.fit(X_train, y_train)
# Export the decision tree to DOT format
dot_data = export_graphviz(
clf,
out_file=None,
feature_names=features,
class_names=['Not Survived', 'Survived'],
filled=True,
rounded=True,
special_characters=True
)
# Use pydotplus to create a graph from the DOT data
graph = pydotplus.graph_from_dot_data(dot_data)
# Display the graph in a Jupyter Notebook
Image(graph.create_png())
# Save the graph to a file (optional)
# graph.write_png("titanic_decision_tree.png")
Score: 0
Category: pydotplus