Tips-Seaborn
Fri 14 November 2025
!python --version
Python 3.10.5
import seaborn as sns
import matplotlib.pyplot as plt
import pandas as pd
# Load the dataset
tips = sns.load_dataset("tips")
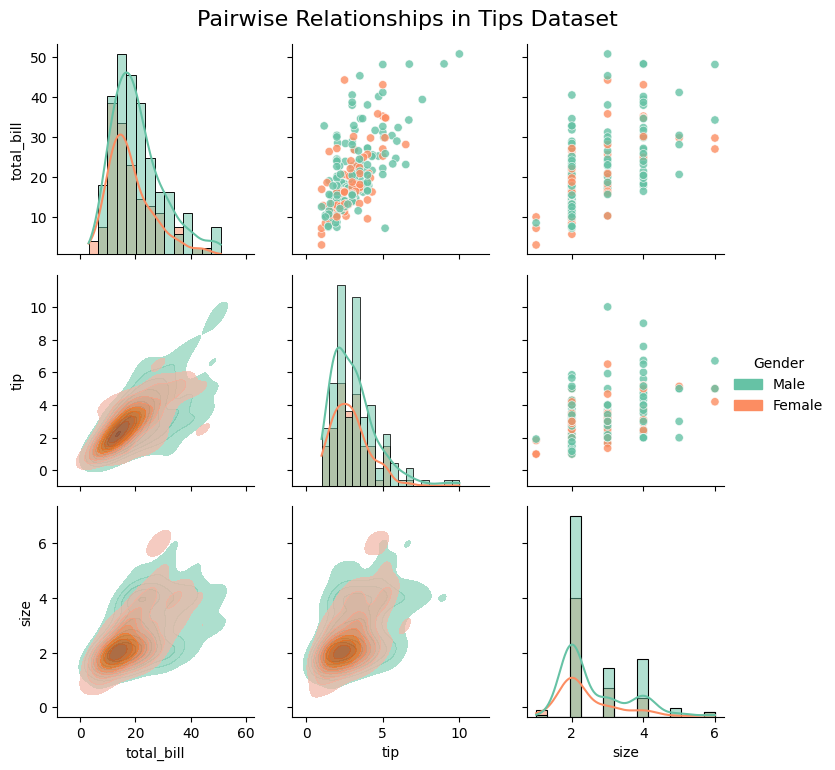
# Create a PairGrid with regression and histogram plots
g = sns.PairGrid(tips, diag_sharey=False, hue="sex", palette="Set2")
g.map_upper(sns.scatterplot, alpha=0.8)
g.map_lower(sns.kdeplot, fill=True, alpha=0.7)
g.map_diag(sns.histplot, kde=True)

# Add a title
g.fig.suptitle("Pairwise Relationships in Tips Dataset", fontsize=16, y=1.02)

# Customize legend
g.add_legend(title="Gender", adjust_subtitles=True)

# Show plot
plt.show()
Score: 5
Category: seaborn