Horizontal-Bar
Fri 14 November 2025
# http://matplotlib.org/1.2.1/examples/pylab_examples/barh_demo.html
import numpy as np
import pylab as pl
import matplotlib.pyplot as plt
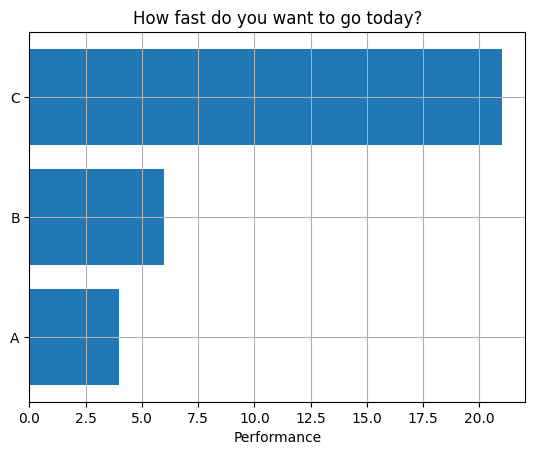
val = [4, 6, 21]
pos = np.arange(len(val)) + .5 # the bar centers on the y axis
pl.figure(1)
plt.barh(pos, val, align='center')
plt.yticks(pos, ('A', 'B', 'C'))
plt.xlabel('Performance')
plt.title('How fast do you want to go today?')
plt.grid(True)
plt.show()
Score: 0
Category: barchart