My-Personal-Pynotes-Growth
Fri 14 November 2025
import matplotlib.pyplot as plt
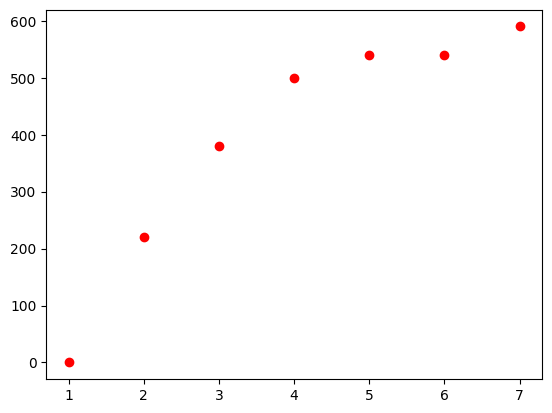
x = [1, 2, 3, 4, 5, 6, 7]
y = [
    0,
    220,
    380,
    500,
    540,
    540,
    590,
]
y
[0, 220, 380, 500, 540, 540, 590]
plt.plot(x, y, 'ro')

# plt.axis([0, 10, 20, 100])
[<matplotlib.lines.Line2D at 0x7f895c338c20>]
Score: 5
Category: plot