Radar-Chart-Simple
Fri 14 November 2025
title: "Radar Chart Simple" author: "Rj" date: 2019-04-20 description: "List Test" type: technical_note draft: false
import matplotlib.pyplot as plt
import pandas as pd
from math import pi
df = pd.DataFrame({
    'group' : ['A', 'B', 'C', 'D'],

    'var1' : [10, 20, 30, 4],
    'var2' : [2, 88, 22, 2]
})
df
| group | var1 | var2 | |
|---|---|---|---|
| 0 | A | 10 | 2 |
| 1 | B | 20 | 88 |
| 2 | C | 30 | 22 |
| 3 | D | 4 | 2 |
# number of variable
categories = list(df)[1:]
N = len(categories)
# Assign values
values = df.loc[0].drop('group').values.flatten().tolist()
values += values[:1]
values
[10, 2, 10]
angles = [n / float(N) * 2* pi for n in range(N)]
angles += angles[:1]
angles
[0.0, 3.141592653589793, 0.0]
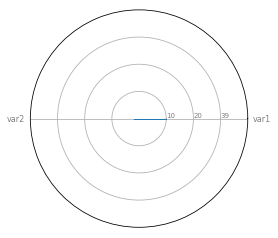
# Initiliaze Spider plot
ax = plt.subplot(111, polar=True)

plt.xticks(angles[:-1], categories, color='grey', size=8)

ax.set_rlabel_position(0)
plt.yticks([10, 20, 30], ["10", "20", "39"], color="grey", size=7)
plt.ylim(0, 40)


# Plot data
ax.plot(angles, values, linewidth=1, linestyle='solid')

ax.fill(angles, values, 'b', alpha=0.1)
[<matplotlib.patches.Polygon at 0x119d7f710>]
Score: 5
Category: plot