Random-Plot-10Years
Fri 14 November 2025
title: "Random Plot 10 years" author: "Rj" date: 2019-05-06 description: "List Test" type: technical_note draft: false
import numpy as np
import pandas as pd
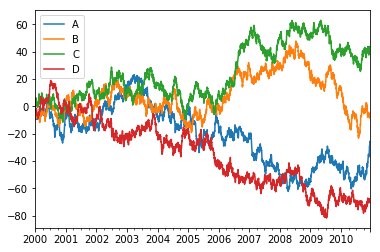
df = pd.DataFrame(np.random.randn(4000, 4), index=pd.date_range('1/1/2000', periods=4000), columns=list('ABCD'))
df.head()
| A | B | C | D | |
|---|---|---|---|---|
| 2000-01-01 | -1.784755 | -0.673046 | 1.126506 | -0.306832 |
| 2000-01-02 | -2.915124 | -1.512690 | -0.116375 | 2.526247 |
| 2000-01-03 | 1.486783 | -0.827375 | 0.510406 | -0.406183 |
| 2000-01-04 | -1.288162 | -1.455968 | -0.212177 | -0.474076 |
| 2000-01-05 | -0.787701 | -0.048756 | -1.552077 | -2.018627 |
df = df.cumsum()
df.plot()
<matplotlib.axes._subplots.AxesSubplot at 0x113eb0710>
Score: 5
Category: plot