Random-Plot-Simple
Fri 14 November 2025
title: "Random Plot Simple" author: "Rj" date: 2019-05-06 description: "List Test" type: technical_note draft: false
import numpy as np
import pandas as pd
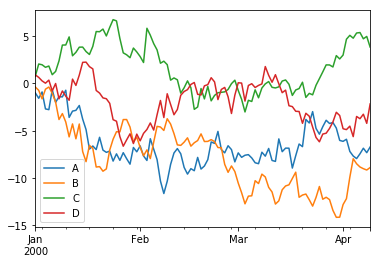
df = pd.DataFrame(np.random.randn(100, 4), index=pd.date_range('1/1/2000', periods=100), columns=list('ABCD'))
df.head()
| A | B | C | D | |
|---|---|---|---|---|
| 2000-01-01 | -0.996724 | -0.378036 | 0.779475 | 0.903508 |
| 2000-01-02 | -0.571293 | -0.348798 | 1.272404 | -0.262368 |
| 2000-01-03 | 0.673788 | -0.895174 | -0.078577 | -0.371040 |
| 2000-01-04 | -1.792242 | 1.015611 | -0.267689 | -0.241193 |
| 2000-01-05 | -0.081370 | 0.230835 | 0.135019 | 0.321915 |
df = df.cumsum()
df.plot()
<matplotlib.axes._subplots.AxesSubplot at 0x108be9c88>
Score: 5
Category: plot