Simple-Bar-Chart
Fri 14 November 2025
import pylab as pl
import datetime
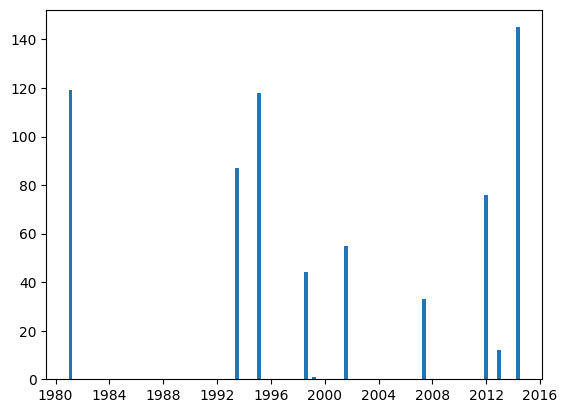
data = """0 14-11-2003
1 15-03-1999
12 04-12-2012
33 09-05-2007
44 16-08-1998
55 25-07-2001
76 31-12-2011
87 25-06-1993
118 16-02-1995
119 10-02-1981
145 03-05-2014"""
values = []
dates = []
for line in data.split("\n"):
x, y = line.split()
values.append(int(x))
dates.append(datetime.datetime.strptime(y, "%d-%m-%Y").date())
fig = pl.figure()
ax = pl.subplot(111)
ax.bar(dates, values, width=100)
ax.xaxis_date();
pl.show()
Score: 0
Category: barchart