Simple-Plot-20241203
Fri 14 November 2025
!pip show matplotlib | grep "Version:"
Version: 3.9.3
# !pip install matplotlib
import matplotlib.pyplot as plt
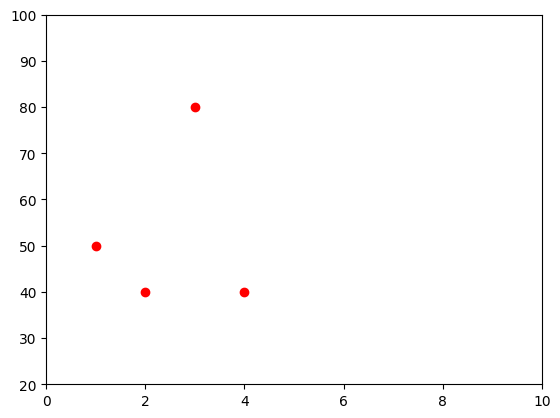
x = [1, 2, 3, 4]
y = [50, 40, 80, 40]
x, y
([1, 2, 3, 4], [50, 40, 80, 40])
plt.plot(x, y, 'ro')

plt.axis([0, 10, 20, 100])
(0.0, 10.0, 20.0, 100.0)
Score: 10
Category: plot