Two-Bars-Mob
Fri 14 November 2025
import numpy as np
import matplotlib.pyplot as plt
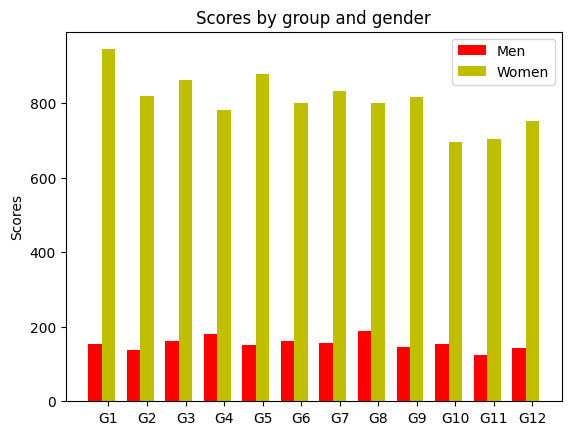
menMeans = (154, 138, 161, 181, 151, 162, 156, 188, 145, 153, 124, 144);
N = len(menMeans);
print(type(menMeans));
ind = np.arange(N) # the x locations for the groups
width = 0.35 # the width of the bars
fig, ax = plt.subplots()
rects1 = ax.bar(ind, menMeans, width, color='r')
womenMeans = (944, 818, 861, 781, 877, 799, 832, 801, 816, 696, 703, 752);
rects2 = ax.bar(ind + width, womenMeans, width, color='y')
# add some text for labels, title and axes ticks
ax.set_ylabel('Scores')
ax.set_title('Scores by group and gender')
ax.set_xticks(ind + width)
ax.set_xticklabels(('G1', 'G2', 'G3', 'G4', 'G5', 'G6', 'G7', 'G8', 'G9', 'G10', 'G11', 'G12'))
ax.legend((rects1[0], rects2[0]), ('Men', 'Women'))
plt.show()
<class 'tuple'>
Score: 0
Category: barchart