Random-Plot-10Years
title: "Random Plot 10 years"
author: "Rj"
date: 2019-05-06
description: "List Test"
type: technical_note
draft: false
import numpy as np
import pandas as pd
df = pd.DataFrame(np.random.randn(4000, 4), index=pd.date_range('1/1/2000', periods=4000), columns=list('ABCD'))
Read More
Random-Plot-Simple
title: "Random Plot Simple"
author: "Rj"
date: 2019-05-06
description: "List Test"
type: technical_note
draft: false
import numpy as np
import pandas as pd
df = pd.DataFrame(np.random.randn(100, 4), index=pd.date_range('1/1/2000', periods=100), columns=list('ABCD'))
Read More
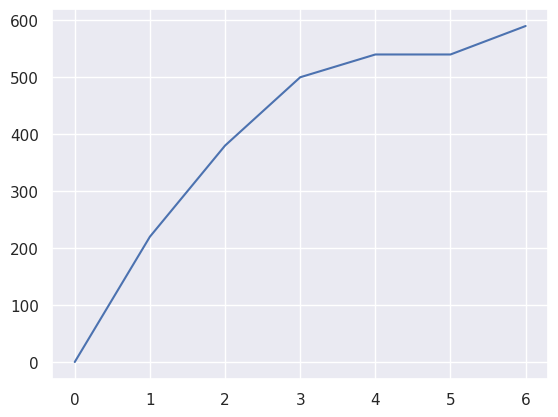
Seaborn-Pynotes-Growth
# https://seaborn.pydata.org/installing.html
# https://stackabuse.com/seaborn-line-plot-tutorial-and-examples/
!pip show seaborn | grep "Version:"
import matplotlib.pyplot as plt
import seaborn as sns

sns.set_theme(style="darkgrid")

x = [
    0,
    220,
    380,
    500,
    540,
    540,
    590
]

sns.lineplot(x)
plt.show()
Read More
Simple-Plot
title: "Simple Plot"
author: "Rj"
date: 2019-04-20
description: "List Test"
type: technical_note
draft: false
import matplotlib.pyplot as plt
import numpy as np
N = 128
x = np.linspace(-5, 5, N)
y = np.exp(-x**2)

y_fft = np.fft.fftshift(np.fft.fft(y).real)
plt.plot(x, y_fft)

plt …
Simple-Plot-20241203
!pip show matplotlib | grep "Version:"
# !pip install matplotlib
import matplotlib.pyplot as plt
([1, 2, 3, 4], [50, 40, 80, 40])
plt.plot(x, y, 'ro')

plt.axis([0, 10, 20, 100])
Sin-Plot
title: "Sin Plot"
author: "Rj"
date: 2019-04-20
description: "List Test"
type: technical_note
draft: false
import numpy as np
import matplotlib.pylab as plt
[20 21 22 23 24 25 26 27 28]
[ 0.91294525 0.83665564 -0 …
Subplot Simple
title: "Sub Plot Simple"
author: "Rj"
date: 2019-04-20
description: "List Test"
type: technical_note
draft: false
import matplotlib.pyplot as plt

python_course_green = "#476042"
plt.figure(figsize=(6, 4))
plt.subplot(221) # equivalent to: plt.subplot(2, 2, 1)
<matplotlib.axes._subplots.AxesSubplot at 0x11365e1d0>
plt.text(0.5, # x coordinate, 0 …